A family member sent a message – by SMS and Skype – that mail bounced. No mention of the reason,
A brief look into the system revealed that just the main process of PMAS was running – no worker processes. So I stopped PMAS – and got a number of error messages – mainly that logicals were not defined.
Next, I looked into the PMAS log files. The first strange thing was that there was a PMAS.LOG-2013-09-04, and a PMAS.LOG – dated 05-Sep-2013. I would expect files PMAS.LOG-2013-09-05, PMAS.LOG-2013-09-06 and PMAS.LOG-2013-09-07, but these were all missing.PMAS.LOG however ended with the last message at 22:26:34.06, a message being quarantined. But after that, it seems no new messages were received!
Looking into PMAS_STARTUP.LOG, that contains all messages also sent to OPCOM (and therefore, be logged in OPERATOR.LOG) revealed why:
 5-SEP-2013 23:13:23.51 **

   %PTSMTP-E-WORKERDIED, worker PTSMTP    005D  (2126D8E0) terminated unexpectedly

   -PTSMTP-I-WORKEREXIT, worker exiting

   -PTSMTP-E-SOCKETFAILED, failed to create socket - -SYSTEM-W-DEVALLOC, device already allocated to another user

   -PTSMTP-I-WORKERCONN, while processing connection from 62.175.202.16,17314
This specific address (62.175.202.16) continues sending messages at a high rate, until
**  7-SEP-2013 08:57:25.13 **

   %PTSMTP-E-WORKERDIED, worker PTSMTP    022F  (2126B0B5) terminated unexpectedly

   -PTSMTP-I-WORKEREXIT, worker exiting

   -PTSMTP-E-SOCKETFAILED, failed to create socket - -SYSTEM-W-DEVALLOC, device already allocated to another user

   -PTSMTP-I-WORKERCONN, while processing connection from 62.175.202.16,50436
and after that, a number of other addresses took over – it might have been the same source using a anonymiser. These addresse included: 182.18.222.91, 201.240.162.58, 200.37.163.163, 123.16.92.3,
181.67.6.108, 113.172.23.195, and more.
At some point, the main program notices:
**  6-SEP-2013 00:12:25.18 **

   %PTSMTP-I-DBSTATUS, status for configuration PMAS_ROOT:[DATA]PTSMTP.CONF:

   Total of 9310 connections accepted; 0 workers currently active
This happens when someone tries to block the system for the same reason – as, for example in Jily, but the main process was able to restart a new workerprocess:
** 19-JUL-2013 02:12:24.88 **

   %PTSMTP-I-DBSTATUS, status for configuration PMAS_ROOT:[DATA]PTSMTP.CONF:

   Total of 4439 connections accepted; 0 workers currently active
** 19-JUL-2013 04:12:24.88 **
%PTSMTP-I-DBSTATUS, status for configuration PMAS_ROOT:[DATA]PTSMTP.CONF:
Total of 4441 connections accepted; 1 worker currently active
Pid Process Name State Connections Serviced
21257C5F PTSMTP 001D idle 2
and at some moments, the maximum of worker-processes (10) is reached, but it never caused a problem:
** 23-JUL-2013 23:05:44.23 **

   %PTSMTP-I-DBSTATUS, status for configuration PMAS_ROOT:[DATA]PTSMTP.CONF:

   Total of 4891 connections accepted; 10 workers currently active

   Pid      Process Name     State   Connections Serviced

   21257F2D PTSMTP    0024  idle            226

   212530A6 PTSMTP    0025  idle             27

   21261FE7 PTSMTP    0026  exiting           1

   21257068 PTSMTP    0027  exiting           1

   2125FE69 PTSMTP    0028  exiting           1

   2126236A PTSMTP    0029  exiting           1

   2125D3ED PTSMTP    002A  exiting           1

   212602EE PTSMTP    002B  exiting           1

   2125D002 PTSMTP    002C  exiting           1

   2125F883 PTSMTP    002D  exiting           1
since the surplus simply dies out.
But this aabuser had sent so many messages that the last ‘normal’ signal was written early 04-Sep-2013:
**  4-SEP-2013 04:12:25.17 **

   %PTSMTP-I-DBSTATUS, status for configuration PMAS_ROOT:[DATA]PTSMTP.CONF:

   Total of 8050 connections accepted; 2 workers currently active

   Pid      Process Name     State   Connections Serviced

   2126DD69 PTSMTP    0055  idle            174

   21265CA4 PTSMTP    0056  idle             16
After that, one of the server processes crashed, and a second was never brought into existence:
**  4-SEP-2013 06:12:25.17 **

   %PTSMTP-I-DBSTATUS, status for configuration PMAS_ROOT:[DATA]PTSMTP.CONF:

   Total of 8057 connections accepted; 1 worker currently active

   Pid      Process Name     State   Connections Serviced

   -PTSMTP-I-WORKEREXIT, worker exiting

   -PTSMTP-E-SOCKETFAILED, failed to create socket - -SYSTEM-W-DEVALLOC, device already allocated to another user

   -PTSMTP-I-WORKERCONN, while processing connection from 117.217.5.97,10830
** 4-SEP-2013 06:12:25.17 **
%PTSMTP-I-DBSTATUS, status for configuration PMAS_ROOT:[DATA]PTSMTP.CONF:
Total of 8057 connections accepted; 1 worker currently active
Pid Process Name State Connections Serviced
21265CA4 PTSMTP 0056 idle 18
From that moment on, only one worker process remains – but when that one died, another was started. and when the bomb started, one after the other that was created went down:
**  5-SEP-2013 23:13:23.51 **

   %PTSMTP-E-WORKERDIED, worker PTSMTP    005D  (2126D8E0) terminated unexpectedly

   -PTSMTP-I-WORKEREXIT, worker exiting

   -PTSMTP-E-SOCKETFAILED, failed to create socket - -SYSTEM-W-DEVALLOC, device already allocated to another user

   -PTSMTP-I-WORKERCONN, while processing connection from 62.175.202.16,17314
** 5-SEP-2013 23:13:34.03 **
%PTSMTP-E-WORKERDIED, worker PTSMTP 005A (2126A8DC) terminated unexpectedly
-PTSMTP-I-WORKEREXIT, worker exiting
-PTSMTP-E-SOCKETFAILED, failed to create socket - -SYSTEM-W-DEVALLOC, device already allocated to another user
-PTSMTP-I-WORKERCONN, while processing connection from 62.175.202.16,22436
** 5-SEP-2013 23:13:43.06 **
%PTSMTP-E-WORKERDIED, worker PTSMTP 005E (212733E4) terminated unexpectedly
-PTSMTP-I-WORKEREXIT, worker exiting
-PTSMTP-E-SOCKETFAILED, failed to create socket - -SYSTEM-W-DEVALLOC, device already allocated to another user
-PTSMTP-I-WORKERCONN, while processing connection from 62.175.202.16,24835
** 5-SEP-2013 23:14:35.74 **
%PTSMTP-E-WORKERDIED, worker PTSMTP 0060 (21272867) terminated unexpectedly
-PTSMTP-I-WORKEREXIT, worker exiting
-PTSMTP-E-SOCKETFAILED, failed to create socket - -SYSTEM-W-DEVALLOC, device already allocated to another user
-PTSMTP-I-WORKERCONN, while processing connection from 62.175.202.16,6114
** 5-SEP-2013 23:14:47.17 **
%PTSMTP-E-WORKERDIED, worker PTSMTP 0061 (2126C1EC) terminated unexpectedly
-PTSMTP-I-WORKEREXIT, worker exiting
-PTSMTP-E-SOCKETFAILED, failed to create socket - -SYSTEM-W-DEVALLOC, device already allocated to another user
-PTSMTP-I-WORKERCONN, while processing connection from 62.175.202.16,37761
until at some moment, none was active:
**  6-SEP-2013 00:11:58.20 **

   %PTSMTP-E-WORKERDIED, worker PTSMTP    007A  (2126ED0A) terminated unexpectedly

   -PTSMTP-I-WORKEREXIT, worker exiting

   -PTSMTP-E-SOCKETFAILED, failed to create socket - -SYSTEM-W-DEVALLOC, device already allocated to another user

   -PTSMTP-I-WORKERCONN, while processing connection from 62.175.202.16,60929
** 6-SEP-2013 00:12:25.18 **
%PTSMTP-I-DBSTATUS, status for configuration PMAS_ROOT:[DATA]PTSMTP.CONF:
Total of 9310 connections accepted; 0 workers currently active
and it continues. The last statusmessage – that is normally sen every 2 hours – was found to be:
**  8-SEP-2013 14:12:25.19 **

   %PTSMTP-I-DBSTATUS, status for configuration PMAS_ROOT:[DATA]PTSMTP.CONF:

   Total of 10417 connections accepted; 0 workers currently active
until I stopped the program:
**  8-SEP-2013 16:09:23.24 **

   %PTSMTP-I-CTRLEXIT, PTSMTP exiting

   -PTSMTP-I-EXITREQUESTED, exit requested by operator
** 8-SEP-2013 16:09:23.24 **
%PTSMTP-I-DBSTATUS, status for configuration PMAS_ROOT:[DATA]PTSMTP.CONF:
Total of 10464 connections accepted; 0 workers currently active
In the end – when I stopped the service, it has ‘processed’ about 2500 message in 3 days ; these are the ones that actually came through. The number of SYSTEM-W-DEVALLOC messages in those days is about 850, and the number of messages that the service limit has been exceed, is about 90.
The real amount is found in the router logging: from the beginning until I stopped the service, the mail filter had to handle over 2400 message – of which over 1100 sent by 62.175.202.16, several every second.
Too much for PMAS to handle.
From a certain point, several other senders kick in but My guess is these are trying this for a long time; and because PMAS had been overloaded and is unable to start new worker processes, these encounter the same problem as other legitimate senders.
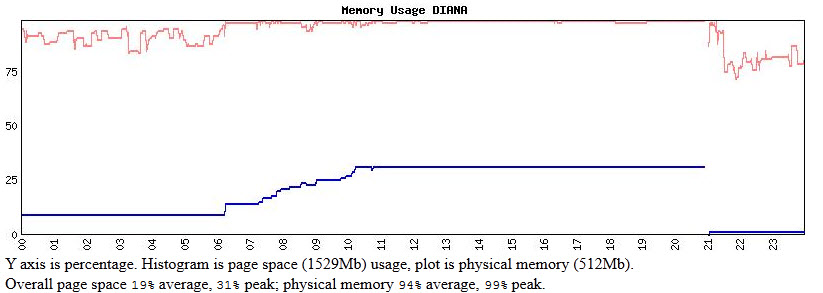
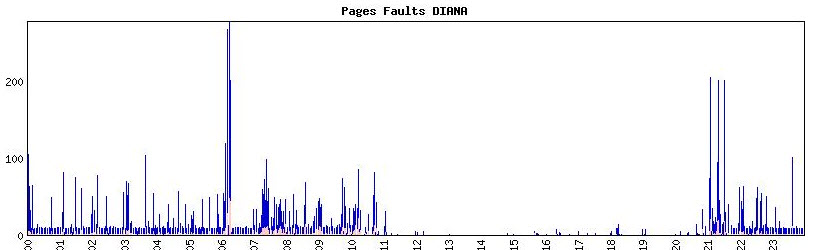
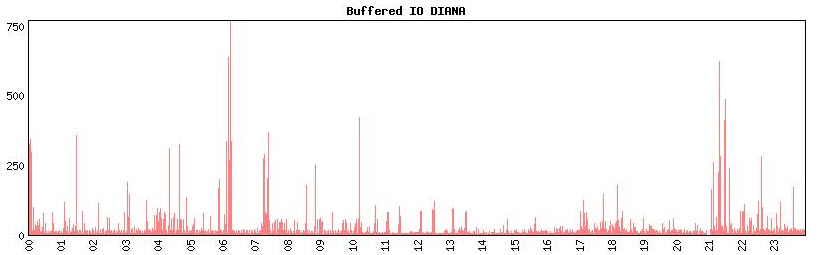
In hypewrSpy – on eof the tools in which I check the system performance – there is no real clue on what was going on. I still have to look into the T4 data but I doubt there will some clue.
In retrospect, last Friday I also noted that there was very little mail coming in – either deliverable of blocked by the system (well – the spam filter).
I have informed Process.com of the issue: That PMAS was unable – for some reason – to create a new process, although the system has slots available (the maximum seen is 67 where I have room for 110 processes), and that PMQAS should block any repeated requests over a certain amount from one address, like I have set for WASD; and signal – by email, for instance, that a site tries to block access to ail.
And, of course, the offending address – owned by ono.com in Spain – has been denied access in the router – and I would like to inform ONO.COM if only I found an address. But the site is already mentions a a potentially dangerous one. Probably trying to relay – but even that cannot be determined. The last log is of 4-Sep-2013 – so there hasn’t been an attempt since than – or could not be written?